JBrowse 2 has the ability to display pairwise comparative data. At WormBase, we have comparative data between these species/assemblies:
- C. elegans N2
- C. elegans Hawaiian strain
- C. elegans VC2010
- C. brenneri
- C. briggsae
- C. inopinata
- C. japonica
- C. remanei
These comparisons are made with minimap2 with the option to generate CIGAR strings. The CIGAR strings allow JBrowse to show the inserts and deletions between the compared genomes. These pre-computed comparisons can be found in a few ways from WormBase’s JBrowse.
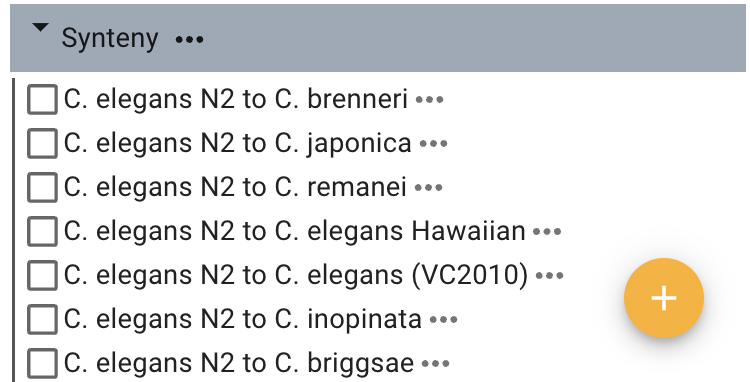
The most straightforward way to find them is to turn on the synteny tracks when browsing the linear genome view of the assembly you are interested in. For any assembly that has comparative genomics data, there is a track checkbox to display the orthologous regions in a related genome. For example, if you are browsing C. elegans N2, you will see a category of tracks called Synteny (usually at the bottom of the long list of tracks) that looks like this:
When I turn on the all of these tracks for N2 in the region around unc-9, it looks like this:

Not surprisingly, the other C. elegans assemblies show a large swath of similarity and the other species show less similarity. The orangish glyphs indicate matches in the same orientation as the reference sequence (N2) and the bluish tracks indicate reverse orientation matches. To examine a given similarity, you can right- or control-click on the match region. For example, if we do that with the long match in C. remanei and we select “Open synteny view for this region” we get this:
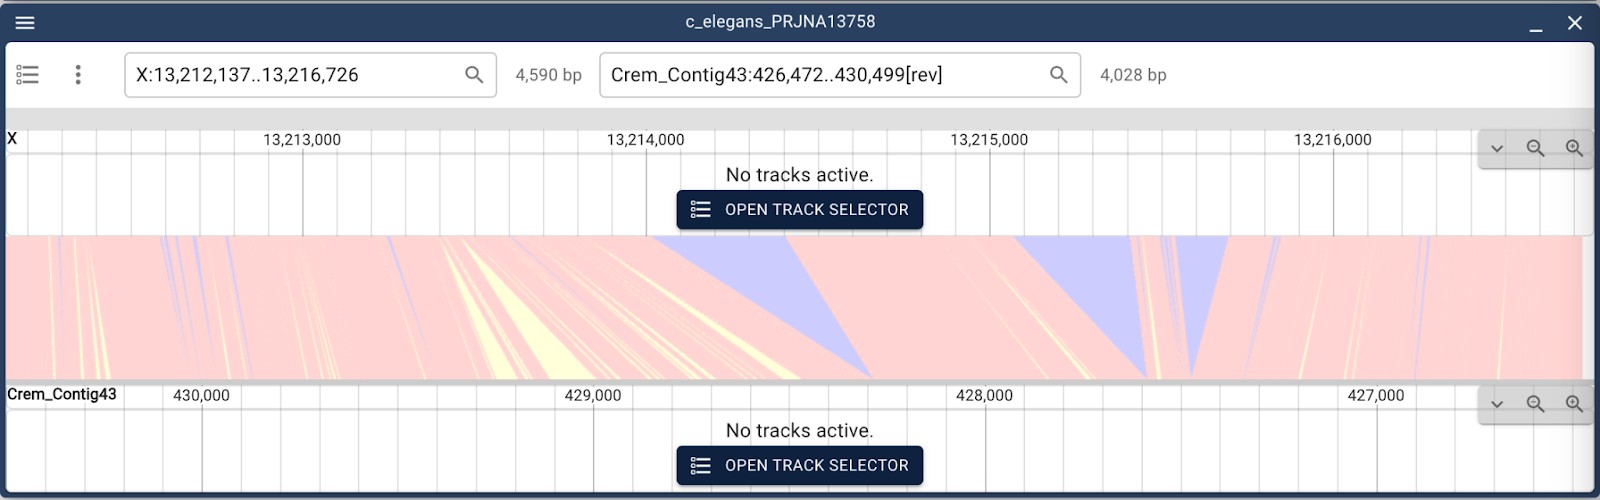
Just from this display, we can see there are blue and yellow triangles to indicate insertions and deletions and the salmon color indicating matches. Also note that the C. remanei region listed in the search box has “[rev]” after location to indicate that JBrowse automatically flipped the orientation to make it easier to read. If you want to flip it back, you can use the view menu by clicking the menu icon in the upper left corner and selecting “Flip orientation” for one of the views.
To make this view a little more useful, there are a few things you can do. First, you can click on each of the open track selector buttons and open tracks that would be of interest, like the Curated Genes tracks. Additionally, you can use the zoom buttons for each track (in the upper right of each track) so that you can see the entire unc-9 gene, which would look like this:

Of course, any track that is available when browsing a genome in the normal genome view is also available in the synteny view. There are several more aspects of this view that can be modified using the view menu which is accessed from the three dots stacked vertically near the left corner of the display. This includes modifying how side scrolling works, what the synteny track connector looks like (straight or curved) and making an SVG of the view.
Dotplots
JBrowse 2 also provides for the creation of whole genome dotplots that are interactive (i.e., zoomable and selectable). To create a dotplot from existing comparative genomic data, select “Dotplot view” from from the “Add” menu at the top of the window. Selecting that results in a dialog to create the view.
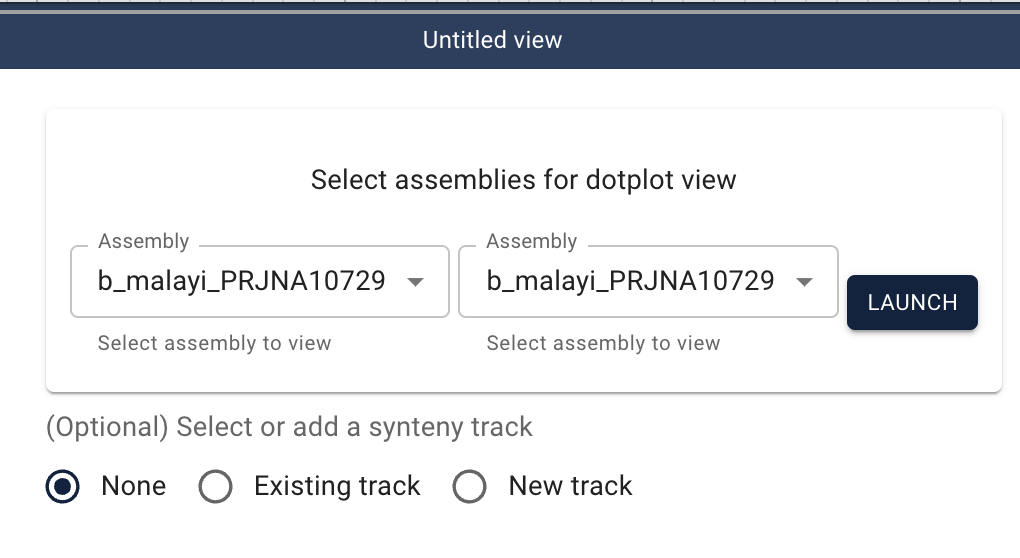
To create a dotplot, you have to select the assemblies for the plot and then identify the existing synteny/comparative genomic data to generate the plot. Generally speaking, we have tried to have the names of the synteny tracks that you see in the linear genome view track selectors should identify the assemblies involved and, importantly, which order they should be selected in this dialog (since order matters). Also, a convention we’ve used is to always have N2 be the first assembly in the selection order when that assembly is involved in dotplot. In this example, we can create a dotplot for the comparison between N2 and C. briggsae. To do that select “C. elegans N2” from the first assembly menu and “C. briggsae” from the second. Then select “Existing data” from the “(Optional) select or add synteny track” section.
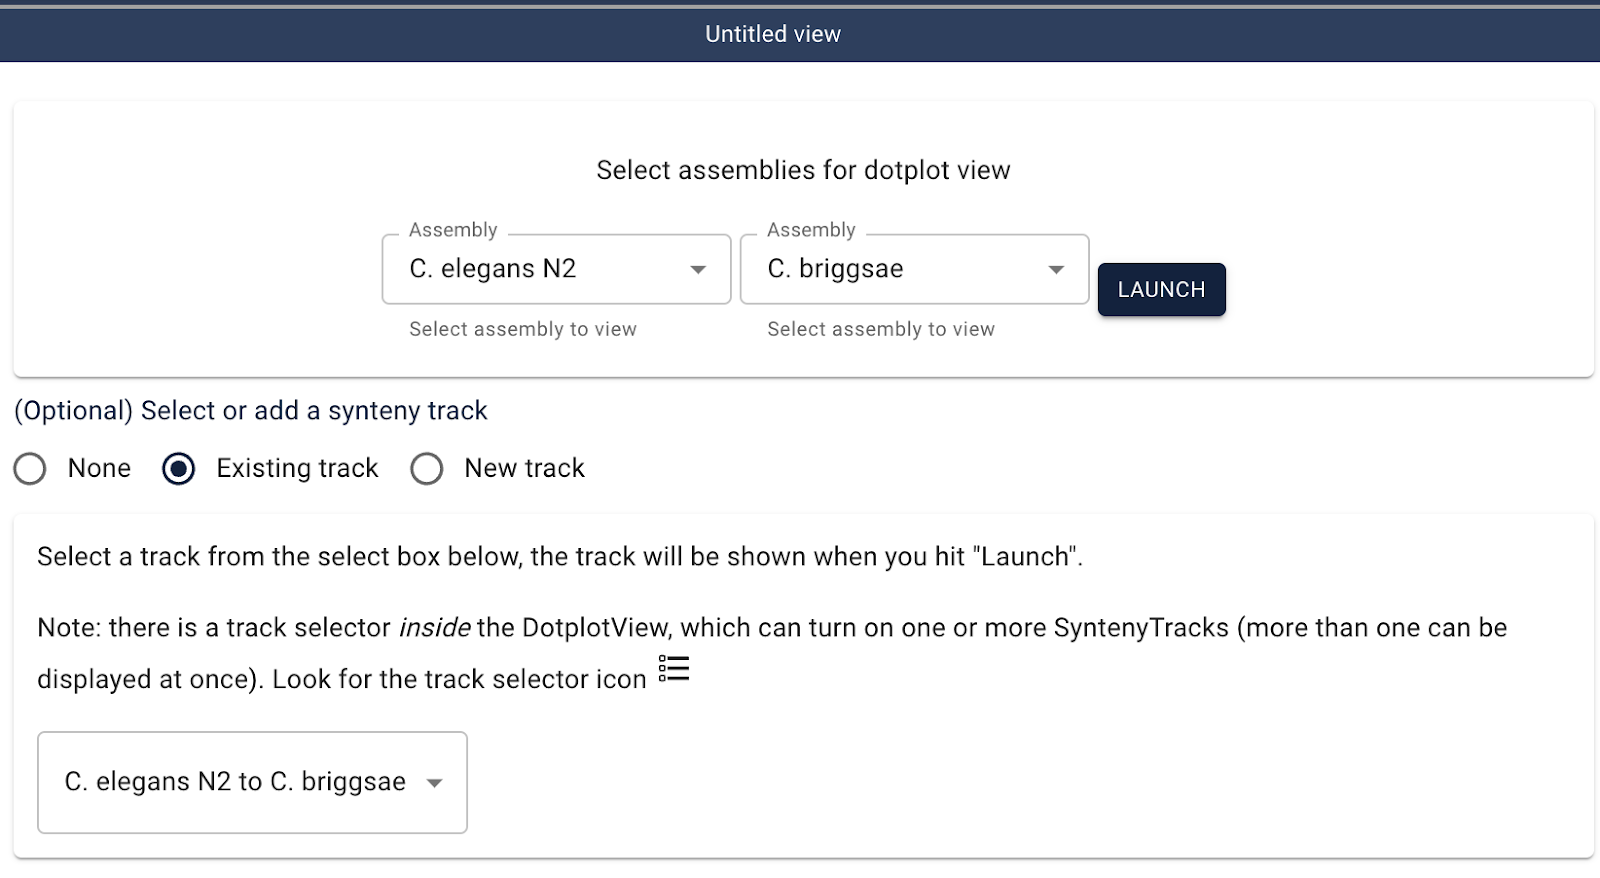
Selecting this changes the dialog box, adding a menu to select the existing dialog to allow the selection of the comparison data for these two assemblies that JBrowse already has access to. Since there is only one data set to choose from, now you can click the launch button and get the resulting dotplot (it will take several seconds to generate the plot):

This dotplot is dynamic: it can be zoomed in on and regions can be selected to open a pairwise synteny view. For example if we click and drag to select a region in II that has reverse orientation synteny, we get a popup menu asking us to zoom or open a synteny view:
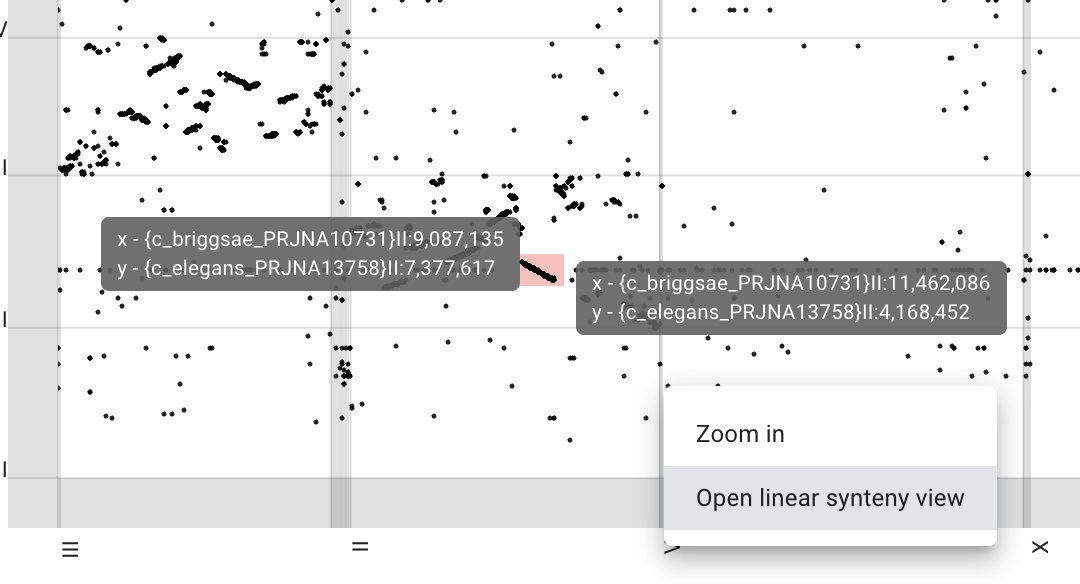
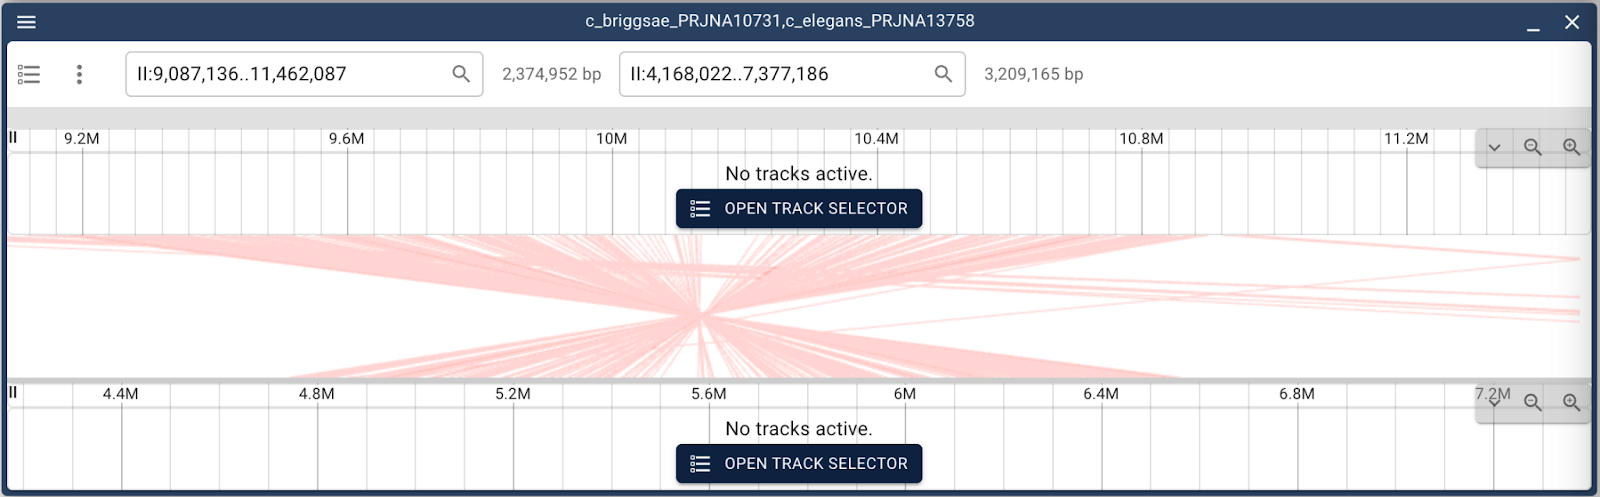
Selecting “Open linear synteny view” will open a synteny view similar to before:
Leave a Reply